Employee Ownership Top 50 2018
The UK’s 50 largest employee owned companies in 2018.
RM2 does the research for the Employee Ownership Top 50, in a partnership with the Employee Ownership Association (EOA); a list of the largest 50 private employee-owned companies in the UK. You can download the infographic by clicking the link below.
Key facts for 2018
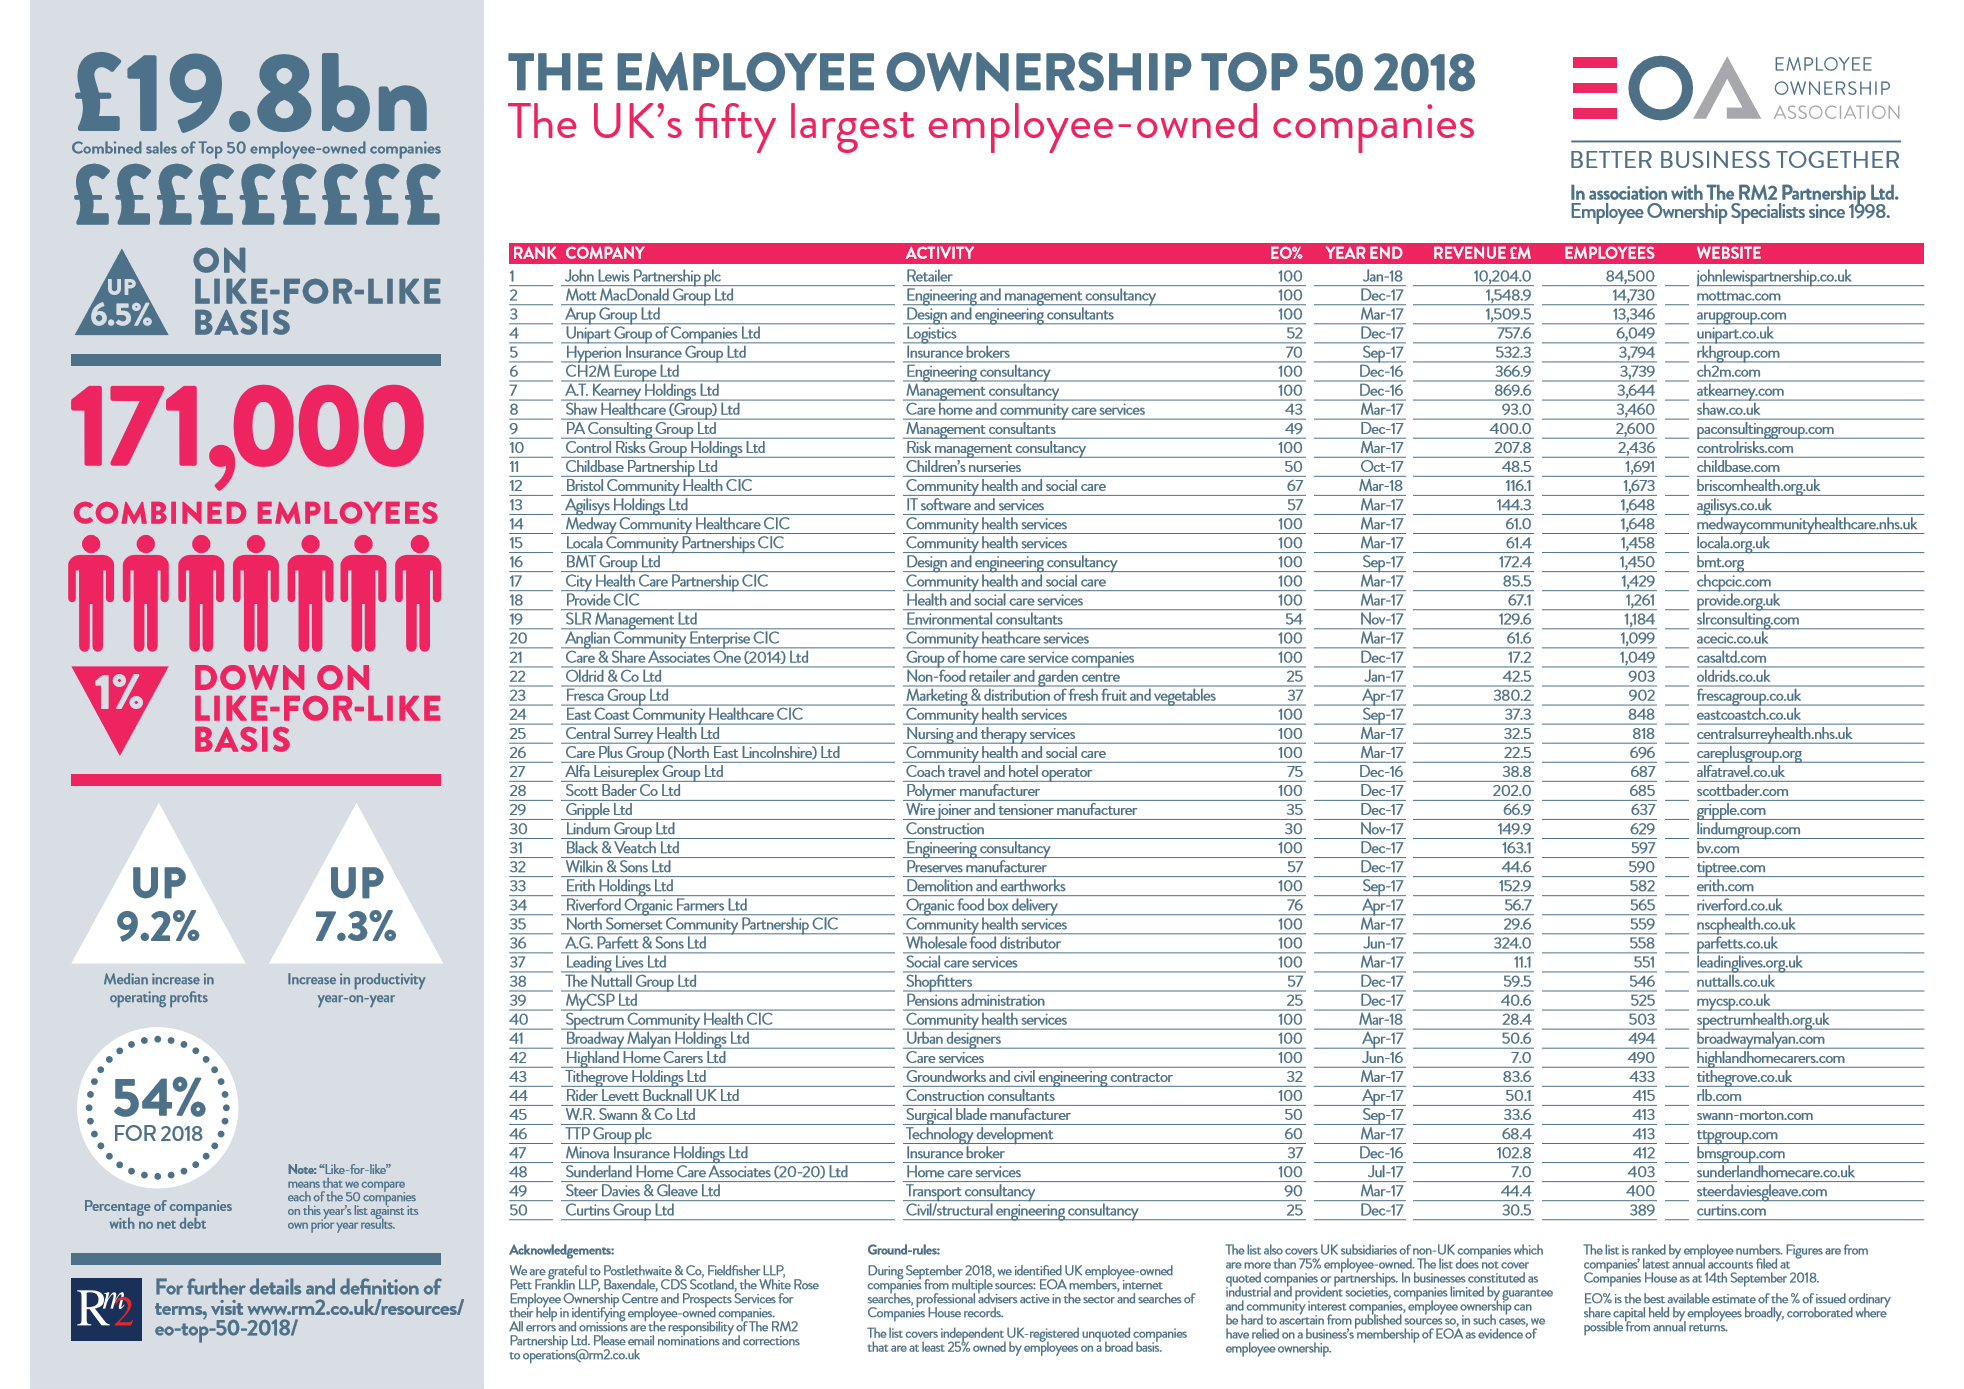
- The combined revenue of the top 50 employee-owned companies is £19.8 billion.
- Revenue of the top 50 increased by 6.5% year-on-year.
- Four of the largest 100 private companies[1] in the UK are employee-owned.
- The combined workforce of the top 50 employee-owned companies is 171,000. This represents around 1% of the private sector workforce in the UK[2]. Employee numbers decreased by 1.0% year-on-year on a like-for-like basis.
- The combined operating profit[3] of the top 50 is £1.34 billion on a like-for-like basis. The median increase in operating profit amongst the top 50 companies compared to the previous year was 10.1%.
- The top 50 are conservatively financed. 23 have net borrowings. Most have cash reserves.
- Value added per employee, which is a measure of productivity, increased by 7.3% year-on-year, twice the rate of growth of productivity in the UK economy as a whole.
- “like-for-like” means we compare each of the 50 companies on this year’s list against its own prior year results.
Ground Rules
Criteria for inclusion: Companies must be incorporated in the UK as companies limited by shares, unquoted, independent and at least 25% owned by employees on a broad basis. Companies may have non-UK holding companies if the UK companies are operationally independent and the non-UK holding companies are at least 75% owned by employees. Shares from joint ventures and associate companies are excluded.
Criteria for exclusion: The list does not cover quoted companies, LLPs or partnerships. In businesses constituted as industrial and provident societies, companies limited by guarantee and community interest companies, employee ownership can be hard to ascertain from published sources so, in such cases, we have relied on a business’s membership of EOA as evidence of employee ownership.
Data collection: Several sources were used, including internet searches, lists of EOA members, Companies House searches and professional advisers active in the sector. Figures for employee numbers and revenues are taken from companies’ latest published annual accounts at Companies House. Estimates of the percentage of employee ownership in each company were sourced from the companies’ own websites or EOA or press reports, corroborated where possible from annual returns.
Disclaimer: Employee ownership data is not systematically published by companies so the list may not be accurate. Nominations for inclusion and corrections should be sent to operations@rm2.co.uk
Definition of terms: Operating profit or EBITDA is defined as earnings before interest, tax, depreciation and amortization. Productivity is defined as value added per employee. Value added is defined as EBITDA plus total wages. Debt is defined as the sum of bank loans and overdrafts, other short term finances and other long term finances minus cash.
[1] Sunday Times Top Track 100 2018
[2] Excluding employees in the public sector and self-employed
[3] EBITDA, meaning earnings before interest, tax, depreciation and amortisation